Berlin’s map is for pros, New York City’s is for the masses.
I have noticed the online tree maps from the Berlin and New York City parks departments are very different and decided to compare them. Both cities have mapped their street trees and made interactive maps and data publicly available but they have interesting differences.

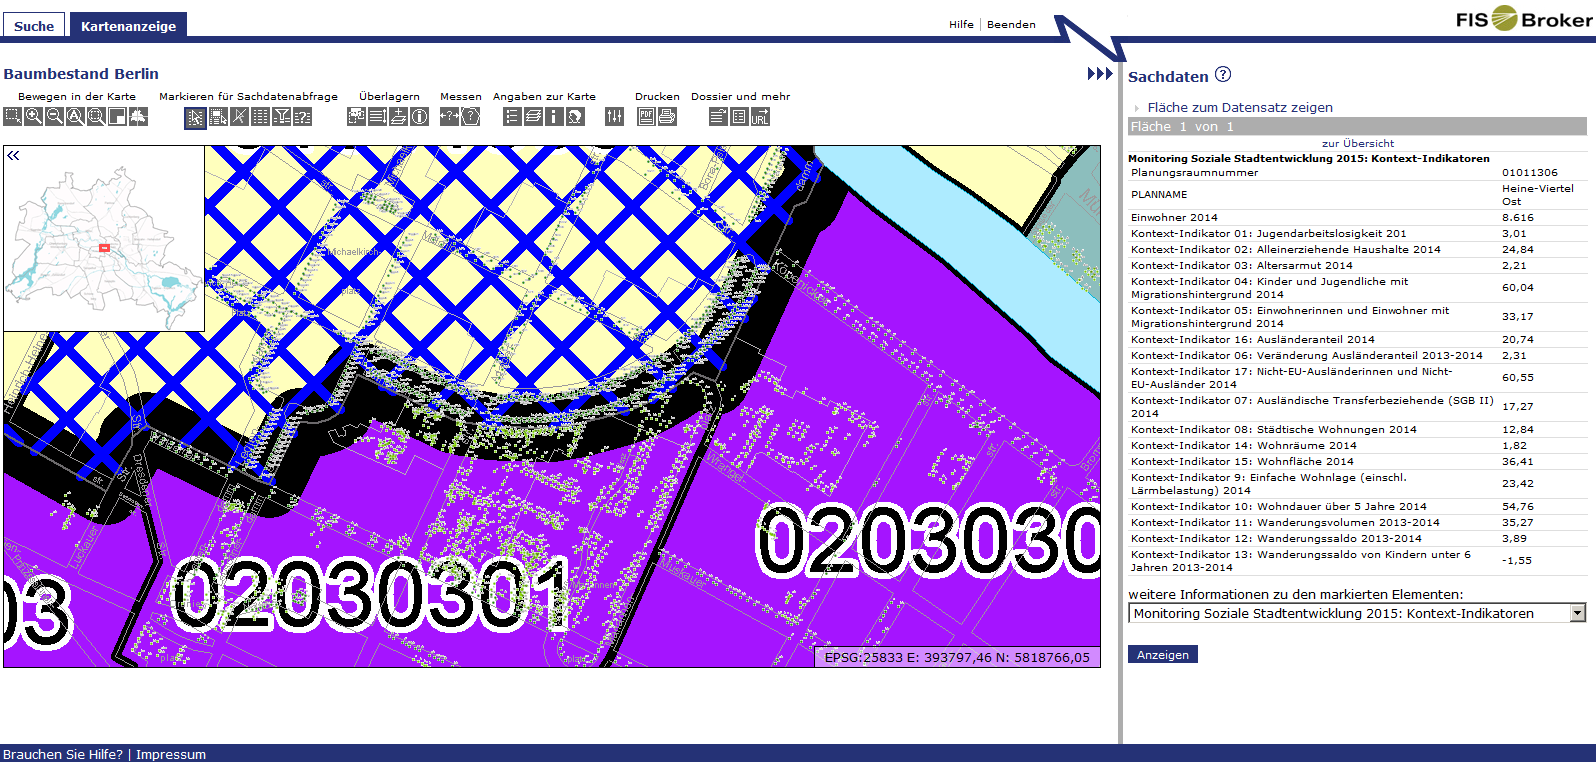
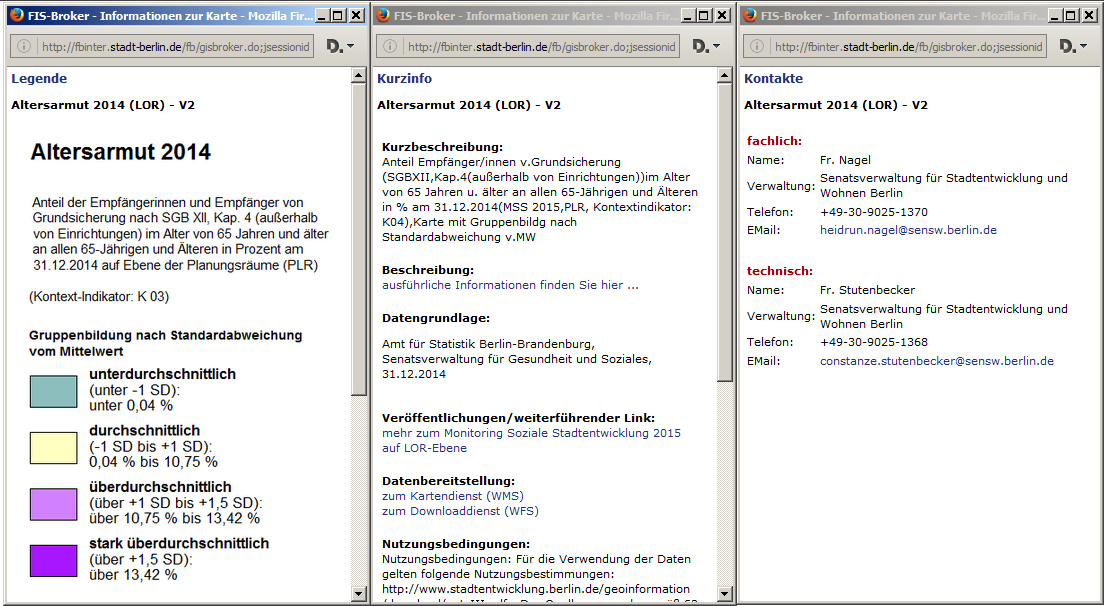
Berlin’s tree map is part of a comprehensive online data mapping service that is good for professionals but too complex for the general public. It is one of 300 or so data maps that can be layered on top of one another to display everything from soils, vegetation and pollution to social, economic and demographic data on residents, to historical maps and aerial photos. For New York you would have to download the raw data from various city data portals and use your own mapping software. However, most people who have any use for this data will have that already, so it’s not much of a drawback. Also, the Berlin site runs so slowly – virtually 1994 dial-up modem slowly (not that interactive maps existed back then) – that it’s hard to imagine anyone using it for a whole project, meaning the pro user will have to download the raw data anyway.
Berlin, critically, includes one piece of information that is essential for urban forest research, and which New York City lacks: the year of planting. I don’t know if the year-of-planting data for New York is available through other channels; either way it’s hard to overstate what a gold mine this is for ecologists because otherwise ascertaining a tree’s age is prohibitively expensive and time-consuming on a large scale. If Berlin’s data includes trunk diameter from prior surveys (I didn’t see it online) in addition to current diameters, this would be a data set of major significance for research on urban tree growth – provided someone found the funding and time to use it, that is.
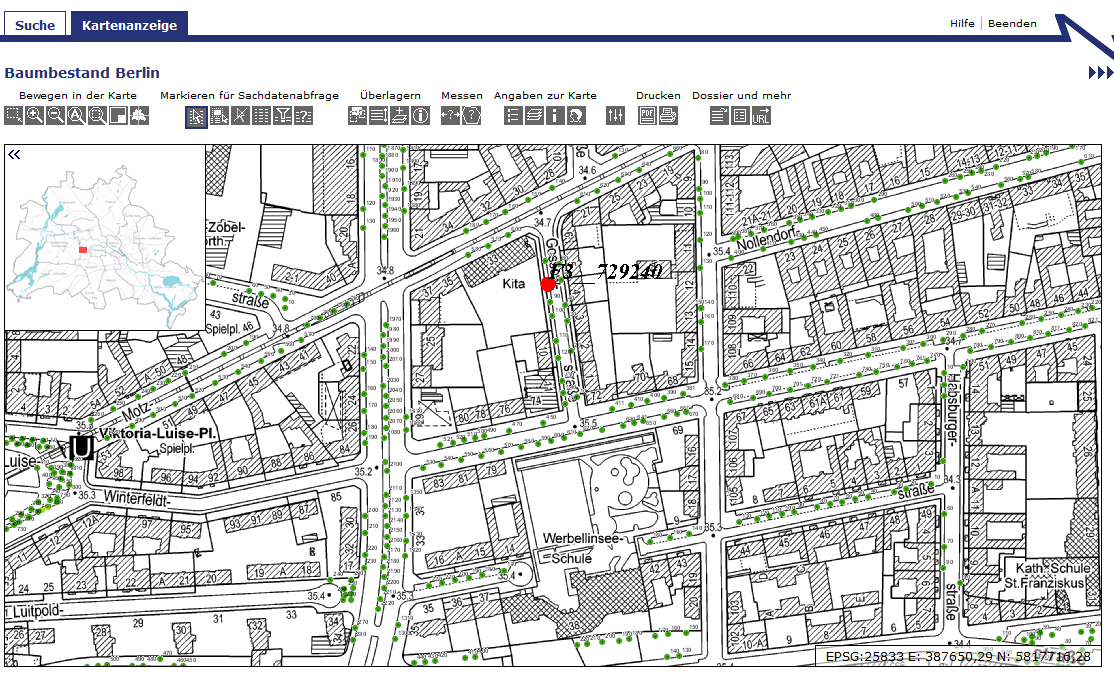

A further limitation is that the tree map can’t display more than a couple blocks at a time and there’s no way to quickly move around to various parts of the city. I haven’t found a way to filter by species but given the tool’s complexity it could be buried in there somewhere.
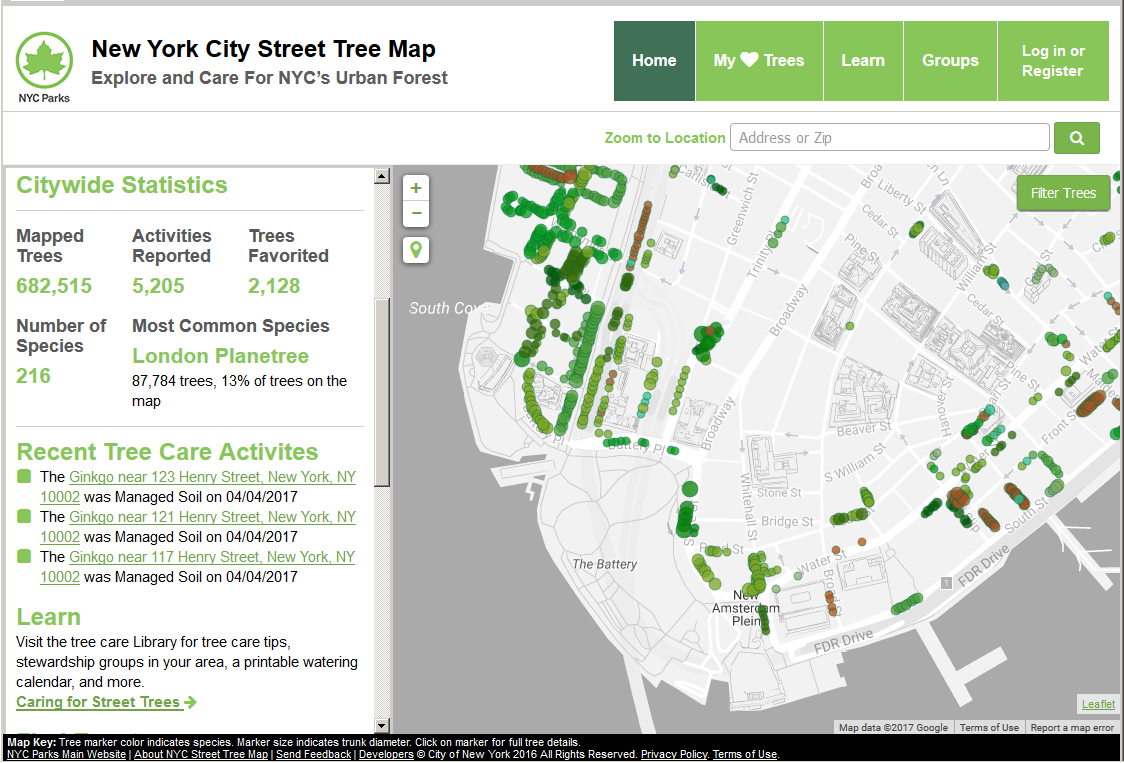
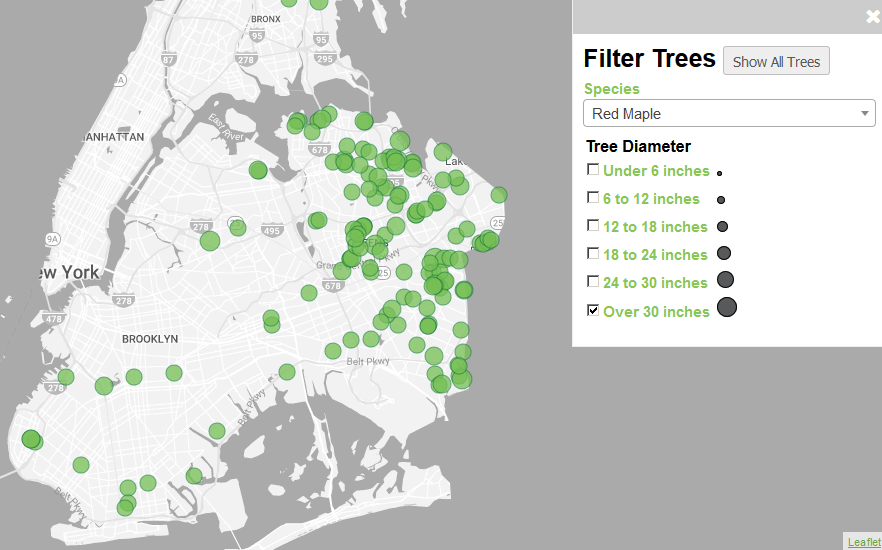
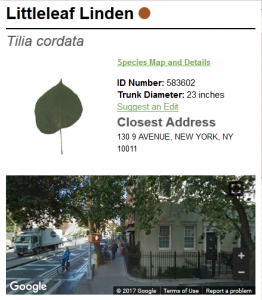
This is where New York City’s excels. The user-friendly interface allows you to instantly see every tree mapped at any scale from your own dwelling, to your neighborhood, borough, or entire city, including photos of every one of the 682,515 mapped trees, a handy description of the species, and an identifying photo of a leaf – and it runs quickly and smoothly on both computers and smartphones.

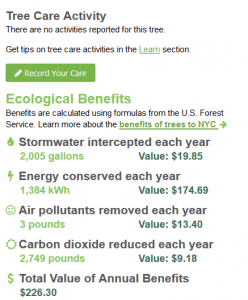
Dollar values are displayed for the value each tree provides per year for a host of environmental benefits such as stormwater retention and energy savings. Berlin’s map lacks these, and in fact the principle of measuring the monetary value of ecosystem services is just now appearing on the horizon in Germany whereas it is established in American ecosystem management. There’s a button for translating the entire site into any language and it really works. Further, anyone who tends a tree – the city promotes watering, pruning and other tree care by volunteers and provides free training – can log their actions for that specific tree.

The drawback, however, is that much of the data was collected by volunteers, unlike in Berlin, in a colossal project called Trees Count! 2015. The same was true for the last survey, in 2005. Data collected by volunteers isn’t as accurate as that collected by trained experts and so the 2005 data was used mainly for estimates about the state of the urban forest and various public-outreach purposes. It didn’t have the accuracy that is needed for scientific research and the actual day-to-day management of the urban forest, care of individual trees, and the like.
However, the 2015 survey is almost certainly much more accurate. Smartphones as we know them did not exist in 2005, tablets definitely not at all. Further, in 2015 the city had just wrapped up eight years of experience managing thousands of volunteers that it didn’t have in 2005, from the MillionTreesNYC project, where volunteers planted around half of the million trees, and this would likely have improved the accuracy of volunteer-collected data.
To sum up: Berlin’s tree map is unlikely to be used by anyone who doesn’t already work with (A) trees and (B) digital mapping as part of their job. New York’s map is easily usable by the general public. For specialists, the integration of Berlin’s tree information, including the valuable age data, into a comprehensive online database, and the reliability of its professionally collected data are advantages.
Are you familiar with Los Angeles’ NavigateLA – a publicly available web based geospatial city and county data browser and repository?
http://navigatela.lacity.org/navigatela/
There are tree data in there. It’s not super obvious where / how to use this system, but it’s easier than having to use your own mapping software and download the data!
Thanks John. This great, I hadn’t seen Los Angeles’ but I have seen a fair amount of other cities with similar outstanding use-friendly online data maps. Soon I will be posting about the next level of maps where they show the hundreds or thousands of stormwater absorption structures for absorbing rainwater into the ground before its pollution reaches sewers and streams, aka bioswales, raingardens, green infrastructure or sponge cities. Lots of US cities have this. Sadly I just went to a launch event with the Berlin Environmental Commissioner where they announced the city’s first steps in thinking about maybe someday trying this stuff out.